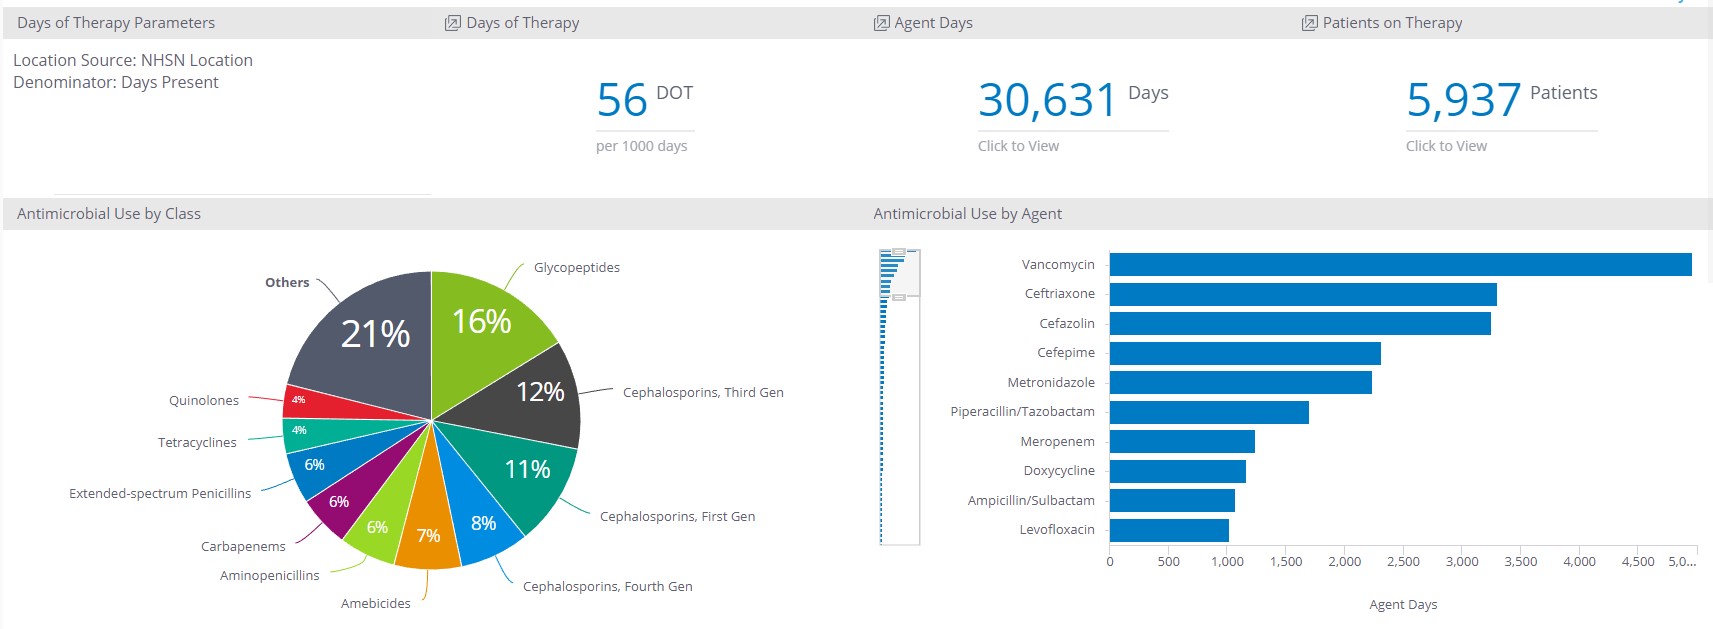
TJC’s Antimicrobial Stewardship Standard Element of Performance 16 requires hospital AMS programs to keep track of their antibiotic use by either measuring Days of Therapy (DOT) per 1000 days present or 1000 patient days, or by submitting Antimicrobial Use (AU) data to NHSN. DOT is defined as any calendar day in which a patient receives at least one dose of an antimicrobial.
Submitting antimicrobial use (AU) data and tracking Days of Therapy (DOT)
In the CDC Core Elements, the agency recommends that hospitals monitor and benchmark antimicrobial use by participating in the NHSN AU Option. Specifically, submitting antimicrobial use data to NHSN compels the hospital to track its antimicrobial administrations using DOT. After submitting AU data from NHSN, AMS leaders can access a risk-adjusted benchmark called Standardized Antimicrobial Administration Ratio (SAAR). SAAR is a metric designed by NHSN to help hospitals understand how its antimicrobial use compares with a national database of hospitals that had been submitting AU data during the baseline period. We will address how AMS programs can use SAAR to benchmark their antimicrobial use in a subsequent article in the Back to AMS Basics series.
Tracking patients on unique treatment and duration of use
In addition to DOTs, program leaders may find it helpful to track the number of patients on unique courses of treatment and duration of use. Tracking the number of patients can help you identify the proportion of patients who are exposed to antimicrobials during their admission, which may have an impact on the development of drug resistance, or acquisition of healthcare-associated infections such as C difficile with their normal flora typically disturbed by the presence of antimicrobials. Such analysis can also be performed at a service line or unit location level as patient demographics and comorbidities often differ, and may reveal different trends and potential targets for improvement.
Tracking top drugs and drug classes
Other metrics that are helpful to track and trend from a global perspective include the top drugs and drug classes used at your hospital. The distribution of antimicrobial class can be used to determine if there’s a “squeezing the balloon” phenomenon from your AMS initiatives. For example, you may have implemented a piperacillin-tazobactam restriction program and noted a decrease of 300 DOTs in carbapenem DOT in the 3 months following the launch of the program. While this is a worthy accomplishment, AMS leaders should monitor DOTs of possible substitutes such as cefepime to ensure that prescribers didn’t just simply replace those antibiotics days with 300 DOTs of cefepime.
Sentri7 Dashboard: DOT and Antimicrobial Use
Interactive data supports effective and efficient antimicrobial data review
Ideally, your data analysis tool incorporates interactivity so you can drill down to identify the patients who had received selected antimicrobials. For example, you may wish to assess the appropriateness of carbapenem use in a defined time period. The review can be much more efficient and less labor-intensive with the help of modern analytics. Some examples of interactive queries that can provide quick insights may include:
- Trending of carbapenem DOTs over time
- Indications for carbapenem prescribing
- Top prescribers and top specialties using carbapenems
- Duration of carbapenem use
- Locations where carbapenems are administered
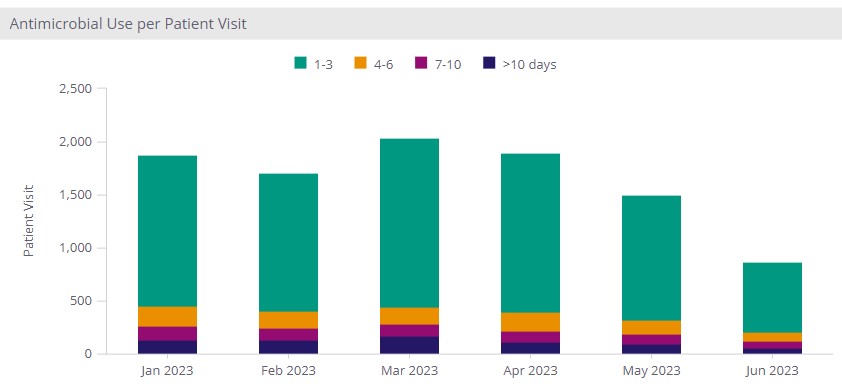
The reporting should also enable AMS leaders to quickly look up the patients who had the carbapenem prescribed to facilitate a Medication Use Evaluation (MUE) if warranted. Measuring duration of use can help you design AMS initiatives that will drive the most impact. If you notice most durations of antimicrobial use are under 3 days, a duration review at 7 days or stop orders may not be as effective as a preauthorization/restriction program, updating order sets for empiric antibiotics, or introducing rapid diagnostic testing.
Sentri7 Dashboard: Antimicrobial Use per Patient Visit
Analyzing Prescribing Patterns
Another facet of DOT metric that may be worthwhile for AMS leaders to further analyze is prescribing pattern. You may find it helpful to review top prescribers and/or specialties to ascertain any trends and potentially problematic areas. For instance, if you noted a significant increase in the use of anti-MRSA agents (e.g. vancomycin, linezolid, daptomycin) among oncologists, you may wish to investigate the antibiogram or consult with your infection preventionists to determine if an outbreak is emerging. Or you may notice significant use of antipseudomonal agents among urologists, which can prompt a review of urine cultures collected in your organization. If the review shows low number of isolates warranting their use, you will now have the data to help drive conversations with the prescribers involved to improve antimicrobial use.
Sentri7 Dashboard: DOT and Antimicrobial Use
Collecting DOT as a numerator as stated by TJC and CDC can be a challenging, labor-intensive process for many hospitals, as electronic health records typically provide reports on how many doses or grams of antimicrobials are administered but not the DOTs as specified above. AMS leaders should collaborate with their IT departments to determine how to meet these recommendations to maintain compliance.
Financial Implications to AU data
In addition to the clinical benefits discussed above, measuring antimicrobial use and submitting AUR data to NHSN may also benefit the hospital financially. Beginning in 2024, the Medicare Promoting Interoperability program requires hospitals to attest their active participation in AUR data submission to NHSN, using an ONC-certified vendor to avoid a downward payment adjustment of Medicare reimbursements. If you are not currently submitting AUR data to NHSN, you may wish to contact your quality and finance departments to discern the potential financial impact. A business case may be built by AMS leaders to secure IT resources to gather and submit AUR data, leveraging the potential negative financial impact of non-compliance.To be clear, measuring DOTs is a good way to track how much antimicrobials are being used, but it is not an assessment of the appropriateness of antimicrobial prescribing. Therefore, AMS leaders should employ business and clinical analytical tools to supplement the usage metrics to identify potential trends and further investigate areas of concern. Clinical assessment and a more detailed level of analysis, such as a chart review, remain helpful tools for evaluating the appropriateness of antimicrobial use.


