In my previous article, I highlighted some of the revealing findings of TeamMate Audit Benchmark, including that only half of audit teams are performing data analytics on every audit.
A further 38 percent are planning to incorporate analytics into every audit, but many are struggling with not having the right tools or skills in the team to do this.
In terms, the skills required to perform audit data analytics, they can be broken into:
- Skills in auditing
- Skills in using a data analytics tool
- Skills in applying data analytics to auditing
Most auditors are covered with respect to number 1 but often less so with 2 and 3.
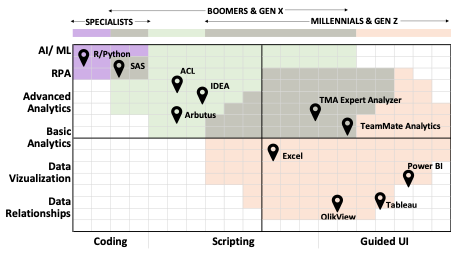
There are a growing number of analytics tools being used to add value to audits, including:
- Specialist tools and coding languages like R, Python, and SQL;
- General data analytics tools such as Alteryx;
- Traditional audit data analytics tools like ACL and IDEA that use scripting to define tests;
- Visualization and BI tools, including Power BI, Tableau, and QlikView;
- Audit-focused guided UI analytics tools for auditors like TeamMate Analytics; and
- Microsoft Excel – still the most used data analytics tool for Audits!
Choosing the right tool for the job
The choice of which tool to use can sometimes be bewildering, but TeamMate Audit Benchmark found that the Audit teams with the most penetration of data analytics are those that are leveraging multiple different tools.
To use an analogy, data analytics tools are a little like hammers – you wouldn’t consider using the same hammer to demolish a brick wall, hang a picture, and tenderize your meat. Different applications and especially user groups require different analytics tools. Auditors light on skills 2 and 3 described above need tools with a low learning curve and guidance to apply them to audits. And, whilst a single analytics tool may promise to cover all your needs, uptake by different teams is likely to be below expectations.

If you have data scientists, they might feel most at home in R or Python. You may also have a couple of auditors who are comfortable with writing scripts, but most ‘regular’ auditors – non-data-analytics experts – need more guided user interfaces to make setting up tests more intuitive.
Many audit teams are looking to empower their whole audit team to perform analytics, enabling them to be integrated into every audit. Teams that have some analytics experts often find they don’t have the capacity to support every audit, and they spend a lot of their time on basic analytics tasks – extracting samples, identifying transactions that fit certain criteria, and so on. Often, data analytics experts aren’t subject matter experts in auditing, so they need to work closely with the audit team to define what is needed.
How TeamMate can help
Analytics for every audit
This is where TeamMate’s Integrated Analytics comes in. It combines the power, flexibility, and audit-specific functions of more traditional script-based tools with a point and click end-user experience they are comfortable with. It even uses Excel – a tool that auditors work in every day – as its familiar interface. This really helps when auditors don’t have skills with a data analytics tool.
TeamMate Analytics straddles both basic and advanced analytics capabilities. More advanced users (or your analytics experts) can use TeamMate Analytics’ Expert Analyzer to create more complex analysis – combining data sources, performing sets of 20 or 30 tests in sequence, creating meaningful reports and visualizations – and then less-experienced auditors can simply customize and run them on their audits. They can even be used for continuous auditing or controls monitoring. But, Expert Analyzer doesn’t require any scripting – an intuitive graphical interface makes creating more advanced analytics a breeze.
TeamMate Analytics also comes with pre-written procedures and a test library with 200 audit-specific tests built in. So, when auditors aren’t already skilled in applying data analytics to audit, this can overcome that barrier.
Integration with audit management
Analytics is integrated with TeamMate+ to automatically incorporate analytics workpapers into your audit evidence and documentation. Any issues found can be raised directly in TeamMate+ from within Analytics, along with review notes. Links can also be created between the detailed Analytics results and documentation within TeamMate+, providing a strong audit trail.
Enforcing the use of analytics
The flexibility of TeamMate+ also helps you to drive analytics usage. By creating custom fields in your documentation templates, you can ensure that auditors consider the use of analytics at all stages – from planning through to sign-off.
Tracking analytics usage
Often, audit teams struggle to track the use of data analytics on their audits, but that’s key to understand progress as you implement or advance your data analytics program. TeamMate+ flags every workpaper that has had analytics performed on it, so you can report KPIs like the percentage of audits that include data analytics in the new TeamInsights reporting tool.
Integrating other analytics tools
For those analytics that you’re performing with other tools – or hammers – you can integrate them with TeamMate+ too. Working papers from other tools can be added right to TeamMate+ as your evidence repository. You can even integrate dashboards created with Power BI, Tableau, and other tools as a custom widget, right into your home page in TeamMate+.
So, however you’re looking to increase the penetration of data analytics and value you get from them, TeamMate has the integrated analytics tools to support you.
TeamMate Audit Benchmark is open
Complete the survey to understand how your team stacks up against five levels of maturity across 14 key areas. Data analytics is just one of them!


